ABSTRACT
This paper demonstrates the errors inherent in using a running total to show near-term trends. A weighted running total rate provides a more clear indication of current trends with a consequently greater indication to management of the need for attention and possible intervention. It is therefore a valuable tool for managers and technicians having responsibility for the control of processes or conditions measured by statistical data over time.
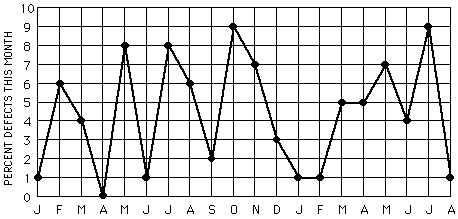
Analysis of statistical data for detection of trends is often complicated by the apparent randomness of such data. For example, the chart below provides random hypothetical data which might be a ratio of defective parts to total parts received per month for a time period of 20 months. We would like to know whether we are getting more defects per month or less, that is, what the trend over time is. The trend in these statistics is not immediately obvious.
One way to smooth out the data is to take a running total for the past 12 months. The 12 month running total for any month m is computed as:
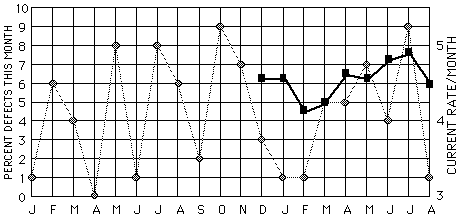
The rate for the month m is defined only after 11 months. It therefore depends equally upon the actual statistic for month m and for all 11 previous months. This rate is plotted for the second year as shown on the following page. The running total rates for January through November of the reference year are not defined, since the period spanned is less than a full year. The running total rate for December is 4.58%, which is the mean of the monthly rates for that year. The rates for January through August of the following year are 4.58%, 4.17%, 4.25%, 4.67%, 4.58%, 4.83%, 4.92% and 4.50%, respectively.
Use of the running total as a basis for rate computation has much to recommend it. It provides a smoothed indicator of the trend in the data and is simple to update. It is also the statistic often required to be reported by Government agencies for certain kinds of data. The running total rate RTm for any month m can be calculated as:
where RTm is the running total rate for the given month, RTm-1 is the running total for the previous month, and Sm is the measured statistic for month m.
The running total rate may be misleading, however, because data for the earliest month included in the computation is given the same weight as data from the current month. This may lead to an incorrect depiction of the trend. The running total is, in fact, not an indicator of trends at all. It is an indicator of history. For example, in the chart shown above, there is no apparent change in the history from December to January, even though the percentage of defects in January is 2% less than the statistic for December. In the computation of the running total, however, the statistic for the previous January, 1%, is discarded when the trend is updated with the statistic for the current January, which is also 1%. We would therefore correctly expect that the history would not change, even though the actual defect ratio has decreased by 2 % from December to January.
In February, the rate is shown as decreasing, even though the defect rate has remained constant at 1%. This is because the statistic for the previous February, 6%, has been discarded when computing the updated rate. The graph therefore shows a sharp decline in the defect rate when no decline actually is experienced.
Only a slight increase is shown for March, even though the actual defect ratio has increased sharply from 1% to 5%. However, the added statistic, 5%, replaces that of the previous March, 4%, which does not produce a significant change.
The rate for April is influenced by the fact that the new statistic, 5%, replaces that of the previous April, which is zero. The history graph therefore shows a moderate increase in the defect ratio, even though the actual percentage of defects is unchanged from the previous month.
For May, the graph is even more misleading. Since the statistic for May, 7%, replaces the statistic for the previous May, which is 8%, the history graph shows a slight decrease in the defect ratio, even though the actual ratio has increased by 2%.
For June, the graph is again misleading, since the June statistic of 4% replaces the previous June statistic of 1%, resulting in an apparent rise in the defect ratio by 3%. The actual change is exactly the opposite, since the actual percentage of defects has decreased from 7% to 4%, which is a decrease of 3%.
The July rate shows only a very slight rise, since the statistic for July, 9%, is only one more than the statistic for the previous July which it replaces, which is 8%. However, the actual situation is much more serious, since the defect ratio during that month has risen from 4% to 9%.
For August, the actual defect ratio has decreased from 9% to 1%, which is the largest decrease depicted on the graph. The history graph shown only a moderate decrease, since the August statistic of 9% replaces the previous August statistic of 6%, which is a decrease of 3%.
These difficulties are inherent in the computation of the running total, and cannot be resolved by changing the number of months over which the running total is taken. Any change in the number of months simply replaces one statistic which is discarded in the monthly update with a new one, which may or may not reflect an incorrect change in the trend for the current month. What is needed is some method of reducing the influence of the discarded statistic in order to give more influence to the current one which replaces it. One way to do this is by the use of a weighted running total. This is similar to the "rule of 78's," which is often used in computation of annual interest on a loan. This weighted running total WRTm, is computed as:
If m is set equal to 12 and n to 1, this formula reduces to:
which, adding the terms in the denominator, becomes:
which is the rule of 78's. Using this rule, we can compute the weighted running totals for the statistics given as shown on the next page.
The defect ratios shown on this chart for December through August of the current year are 5.08%, 4.53%, 3.97%, 4.10%, 4.22%, 4.58%, 4.49%, 5.13% and 4.53%, respectively. The steep decline in January and February reflects the fact that the percentages for November, December and January have been decreasing, even though they remained the same in February. The reverse of this trend in March is shown as a slight rise in the graph, and the fact that the rate is the same in April is reflected by a slight reduction in the rising trend. From then on to August, the weighted running total graph follows the actual data, although it is smoothed somewhat by the previous experience.
In no case does this graph show an increase in the weighted running total in a month in which the actual monthly rate decreases (or vice versa), although it does show a slope other than zero when the actual experience difference from one month to the next is zero. In both such cases, however, the slope is moderated by recent experience.
It may be noted also that the graph is virtually unaffected by discarding the statistic for the thirteenth previous month, since that statistic contributes only 1/78 to the current weighted running total, while the most recent statistic contributes 12/78, or almost 1/6 (actually 2/13) to this value. The weighted running total therefore puts 12 times as much emphasis on the most recent experience as it does to experience a year ago. This gives a more accurate indication of what the most recent experience is now, which is usually the indicator of management interest.
The chief disadvantage of the weighted running total is the difficulty of computation. The calculation for any month m may also be based on that for the previous month. For n = 1 over a 12 month period,
The general form of the equation may be tailored to individual requirements by different choices of n and m. Generally, increasing m will smooth the graph by including proportionately more historical experience. An increase in n will increase the relative significance of more recent data., resulting in a graph that becomes less smooth for more recent data as it more closely tracks the more recent experience. When n = 0, the weighted running total reduces to the unweighted running total. The value n may therefore be considered an exponential weighting factor given to each statistic.
The weighted running total rate provides a more clear indication of "what's happening now," with a consequently greater indication to management of the need for attention and possible intervention. It is much less likely to show a trend different from that in the near term, and it progressively reduces the influence of historical experience over which management has no control. It is therefore a valuable tool for managers and technicians having responsibility for the control of processes or conditions measured by statistical data over time.